Tracing
Dgraph is integrated with OpenCensus to collect distributed traces from the Dgraph cluster.
Trace data is always collected within Dgraph. You can adjust the trace sampling rate for Dgraph queries using the --trace superflag’s ratio option when running Dgraph Alpha nodes. By default, --trace ratio is set to 0.01 to trace 1% of queries.
Examining Traces with zPages
The most basic way to view traces is with the integrated trace pages.
OpenCensus’s zPages are accessible via the Zero or Alpha HTTP port at /z/tracez.
Examining Traces with Jaeger
Jaeger collects distributed traces and provides a UI to view and query traces across different services. This provides the necessary observability to figure out what is happening in the system.
Dgraph can be configured to send traces directly to a Jaeger collector with the trace superflag’s jaeger option. For example, if the Jaeger collector is running on http://localhost:14268, then pass this option to the Dgraph Zero and Dgraph Alpha instances as --trace jaeger=http://localhost:14268.
See Jaeger’s Getting Started docs to get up and running with Jaeger.
Setting up multiple Dgraph clusters with Jaeger
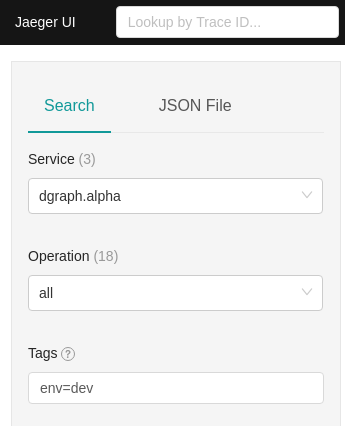
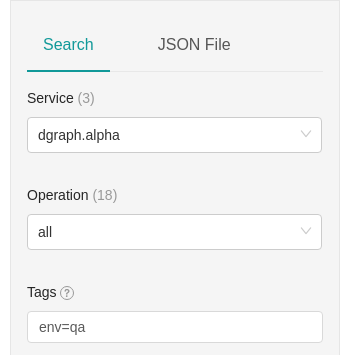
Jaeger allows you to examine traces from multiple Dgraph clusters. To do this, use the --collector.tags on a Jaeger collector to set custom trace tags. For example, run one collector with --collector.tags env=qa and then another collector with --collector.tags env=dev. In Dgraph, set the --trace jaeger option in the Dgraph QA cluster to the first collector and set this option in the Dgraph Dev cluster to the second collector.
You can run multiple Jaeger collector components for the same single Jaeger backend (e.g., many Jaeger collectors to a single Cassandra backend). This is still a single Jaeger installation but with different collectors customizing the tags per environment.
Once you have this configured, you can filter by tags in the Jaeger UI. Filter traces by tags matching env=dev:

Every trace has your custom tags set under the “Process” section of each span:

Filter traces by tags matching env=qa:


To learn more about Jaeger, see Jaeger’s Deployment Guide.